This is the 27th in a series of posts on the Hasselblad X2D 100C camera and the XCD lenses. You will be able to find all the posts in this series by looking at the righthand column on this page and finding the Category “X2D”.
News flash: You can get even greater accuracy if you white balance in Phocus. See here.
In the previous post, I showed you some images made with the Hasselblad X2D, developed using several Lightroom and Phocus profiles. Today’s post is more quantitative, and includes the GFX 100S with two Lightroom profiles. The purpose of this test is to find out more about Hasselblad’s so-called color science — really color engineering — and to get a peak at the secret sauce that is embodied in the X2D and some raw developers.
I did an earlier quantitative test with the GFX 100S and the X2D that resulted in not much advantage for either camera, but it had an unusual illuminant. Color profiles should be designed to work well with a broad range of illuminants, but it’s nor really fair to run one test with an oddball illuminant and call it a day. For this test, the illuminant is one that should be right in the comfort zone of any credible profile: direct sunlight.
Here’s an example of the test shots, this one with the X2D and the XCD 38 lens.
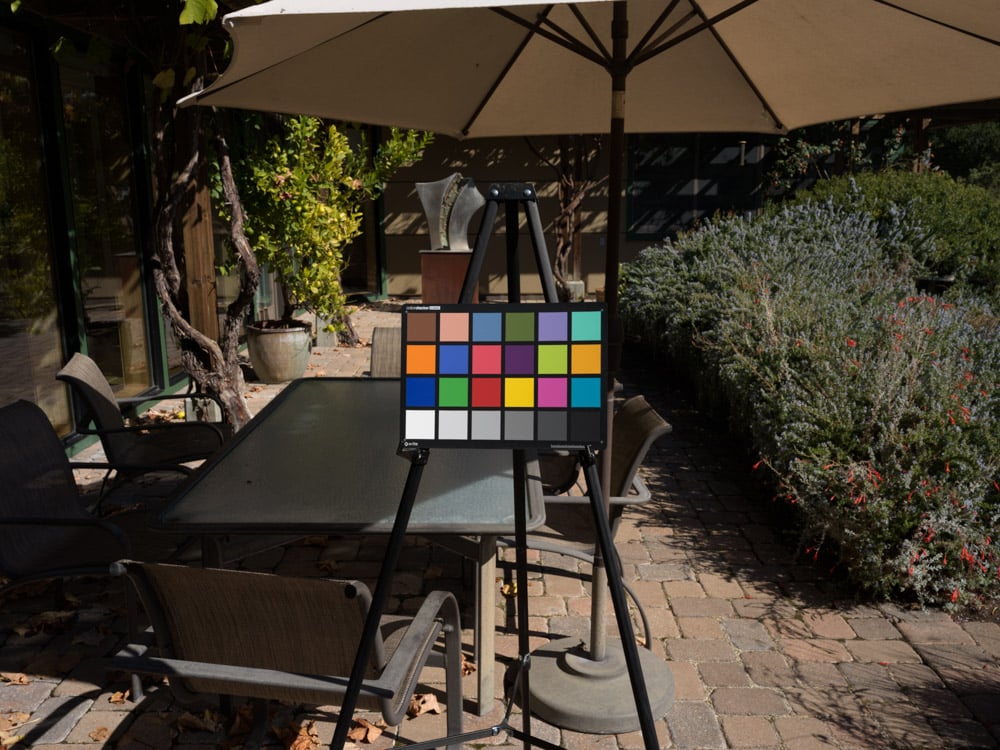
I used the X2D with the XCD 38, and the GFX 100S with the GF 45. Test conditions:
- Arca Swiss C1 on RRS legs
- f/16, 1/50 second, ISO 64 for the ‘blad
- f/16, 1/60 second, ISO 100 for the Fuji
- Developed in Lightroom with defaults except sharpening set to 20, white balanced to second gray patch from the left
- Also, the X2D image was developed in Phocus with defaults except for profile, exported as a TIFF, brought bask into Lr, and white balanced to second gray patch from the left
That last step was performed because the white balance algorithm in Phocus appears to be substantially different from that in Lr.
Profiles used:
- X2D, Lr Classic, Adobe Standard Profile
- GFX 100S, Lr Classic, Adobe Standard Profile
- X2D, Lr Classic, Adobe Color Profile
- GFX 100S, Lr Classic, Adobe Color Profile
- X2D, Lr Classic Camera Standard Profile
- X2D, Phocus, Standard Profile
- X2D, Phocus, Repro Profile
- X2D, Phocus, Repro Low Gain Profile
I analyzed the images with a Matlab program that I wrote. Among other things, I computed 26 statistical metrics for the color of the Macbeth CC24 patches taken as a group. I’ve graphed four of these metrics below for each test condition.
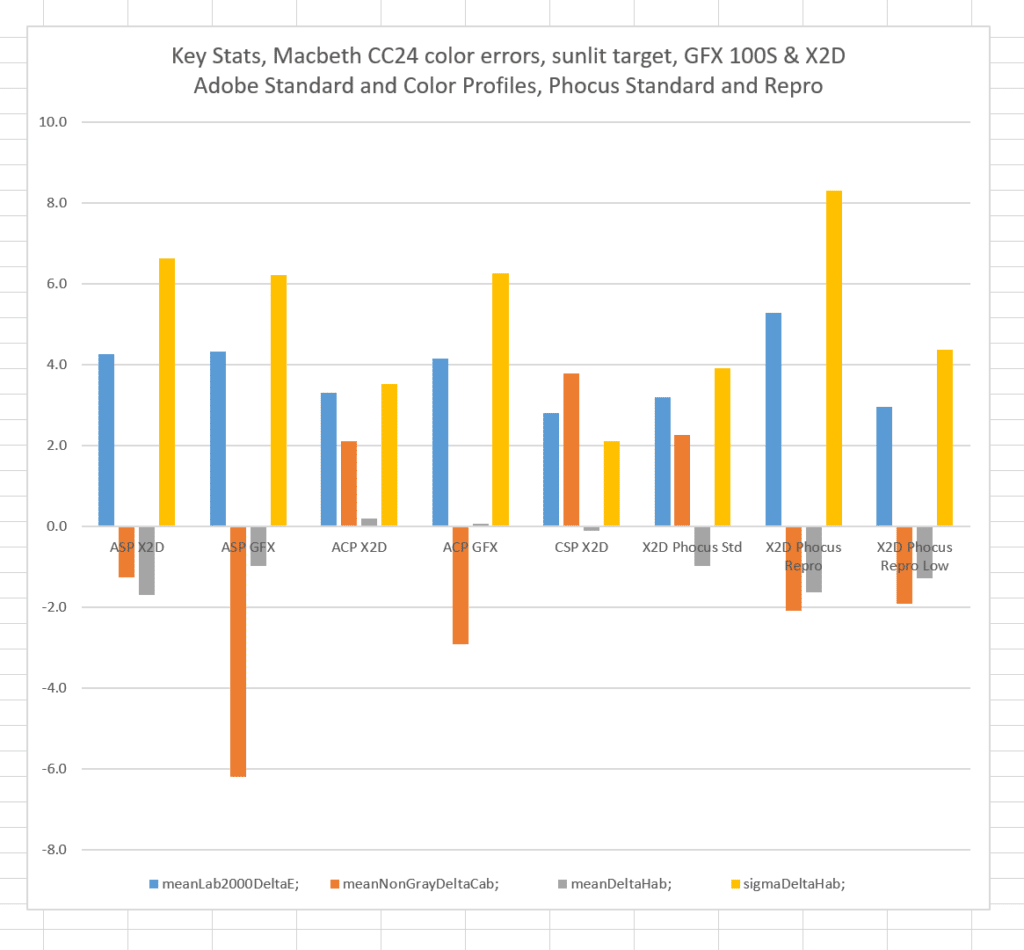
There is a grouping of four bars for each test condition. They are in the same order as the list above.
The blue bars are the average color error for each of the 24 patches, measured in CIELab Delta E 2000. This is probably the most accurate color error metric we have right now. Lower numbers are better. Zero is perfect. The four best results are all for the XCD: Adobe Color profile, Camera Standard Profile, Phocus Standard profile, and Phocus Repro Low Gain. The mean color error for both cameras with Adobe Standard Profile is a bit worse, and pretty much the same for each camera. The GFX with Adobe Color Profile is about the same as the X2D and GFX with Adobe Standard Profile. In the past, I have found ASP to be more accurate than ACP. In this test, that is not the case.
The orange bars are the average errors in CIELab chroma. Low absolute values are better. Positive values indicate that the average patch is more chromatic (loosely, more saturated) than it should be. Negative values indicate that the average patch is less chromatic (loosely, less saturated) than it should be. The best result is for the X2D with ASP development, followed by a grouping of X2D with ACP development, Phocus Standard development, and both Phocus Repro profiles. Close behind is the X2D with Camera Standard Profile. Bringing up the rear is the GFX with ASP.
The gray bars indicate the mean error in hue angle. Low absolute values are better. Positive numbers indicate that the mean hue angle is too large. Negative numbers indicate that the mean hue angle is too small. Hue angle errors are some of the most objectionable color errors. This metric tests for systematic hue errors. The winners are both cameras with Adobe Color Profile, and the X2D with Camera Standard profile.
The yellow bars indicate the standard deviation of the errors in hue angle. Low values are better. Zero is perfect. This metric tests for the scatter of the hue errors. The winners are both cameras with Adobe Color Profile, and the X2D with Camera Standard profile. Camera Standard Profile for the X2D is the best.
Why is Phocus Repro so bad here? I think it’s because it boosts brightness for this image. I don’t know why it does that. I’d take the Phocus Repro data points with a grain of salt.
Summary: in this test, leaving out the repro results, the X2D with ASP, CSP, and Phocus Standard development comes out on top.
It’s entirely optional, but if you’re a glutton for color data, cast your eyes on the table below.
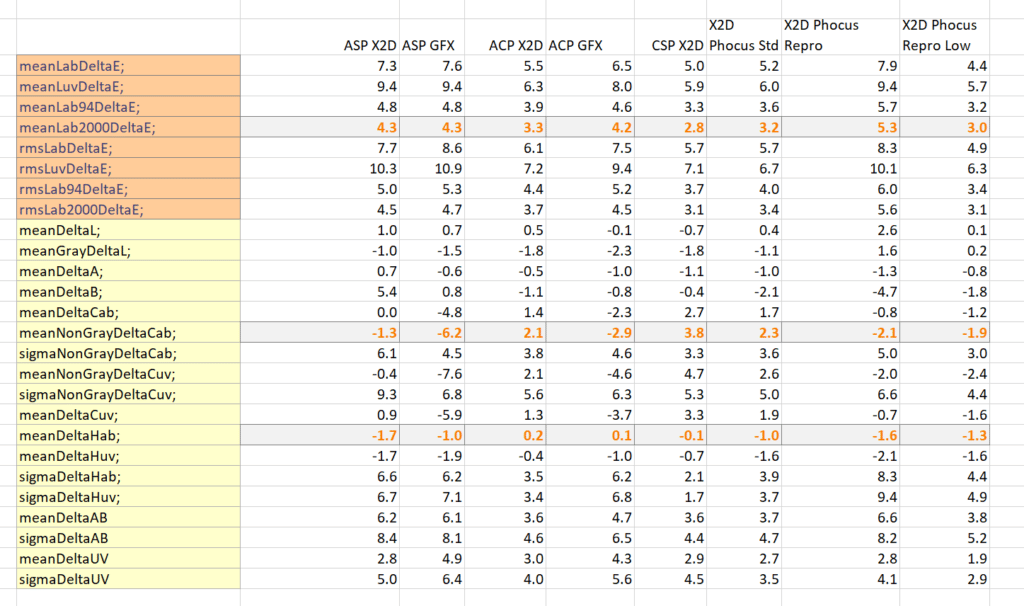
The first eight rows are the total color errors measured with four different criteria: CIELab DeltaE, CIELuv DeltaE, and Lab DeltaE1994 and DeltaE2000. If you want to focus on one of those, use DeltaE2000. The top four rows are the average errors for all 24 patches of the Macbeth color checker chart. The next four rows are the square root of the means of the squares of the errors, and penalize big errors more than the simple average.
The next five rows in the are the average errors in each of the CIELab axes. The last row in that group is the mean errors in chroma. Negative numbers are less chromatic than perfect, and positive numbers are more chromatic. The next group of four is the same thing but leaving out the 6 gray patches in the Macbeth chart.
The next group has 5 members. The first one is the same metric as the last measure in the group above it, but using CIELuv as the basis for the measurements rather than CIELab. Then we have the average hue angle errors in both Lab and Luv, and their standard deviations (aka sigmas).
The last group of four metrics has the mean and standard deviations of the chromaticity errors in CIElab and in CIELuv.
Not sure Im going to convey this properly but seems the color value would differ in Highlights vs Shadows
As the color “say on the nose of a person that is brighter has less color than the shadow”.
So as the target is in daylight and color patches also have different color reflected light falling on them would the reflection of light and unevenness of light affect the resulting graphs shown ?
The sun is 93 million miles away, therefore the illumination falling on a flat surface is essentially uniform.
yes but the color patches reflects the color of the light bouncing off of the surrounding elements outside….trees giving a green cast to the target.
The reflected light falling on the target is well down from the direct sunlight and the skylight. In this scene, it’s below 3%.
Sorry for bringing up the topic again.
May I know the profile used on the files exported from the Phocus before you imported to the LR Classic?
Adobe RGB or Prophoto RGB or the souce?
Thank you.
You mean the color space of the exported files? PPRGB, as I remember. But it shouldn’t make any difference as long as the image is within the gamut of the chosen color space.
Thank you Jim.
I found that the files exported from the Phocus with different color space(Adobe RGB or PPRGB) show different color in Lightroom Classic when I choose the same Adobe Standard Profile for them.
I have no idea why this happened.
In Lr, you can’t apply Adobe Standard Profile to an image that is already in a CIE-referenced color space. And that’s as it should be.
Is that mean the Lr Classic Adobe Color Profile refers to the image exported in Adobe RGB and Lr Classic Camera Standard Profile referes to the image exported in PPRGB?
Thank you.
I don’t think so. Lr only applies color profiles to raw files, not CIE-referenced ones.
Sorry for my ignorance.
Could you please explain me the meaning of the CIE-referenced?
I thought they are all raw files when exported to the TIFF beside the color space.
CIE referenced means that the image is in a color space based on 1931 CIE XYZ. When you export TIFFs from Lr or Phocus, they are in such spaces. Another word for CIE-referenced is colorimetric.
Here’s some background:
https://www.lensrentals.com/blog/2023/03/how-your-camera-and-image-processor-determine-colors/
Thank you for your kindness reply Jim!