In the past few posts on MTF testing, we’ve seen so many things that affect the Imatest MTF50 results that it’s reasonable to look at tests that change very little to find out how much instability there is in the baseline test protocol and the image analysis tools.
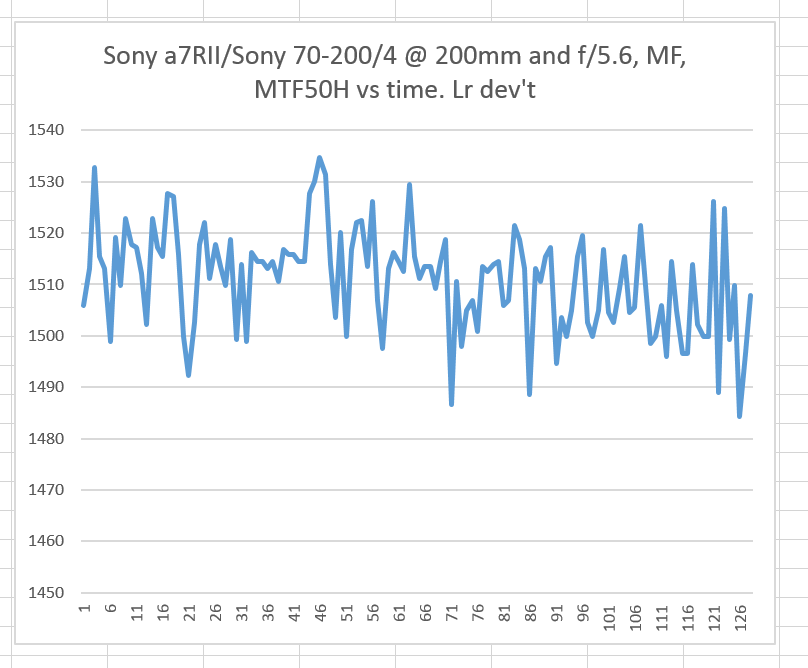
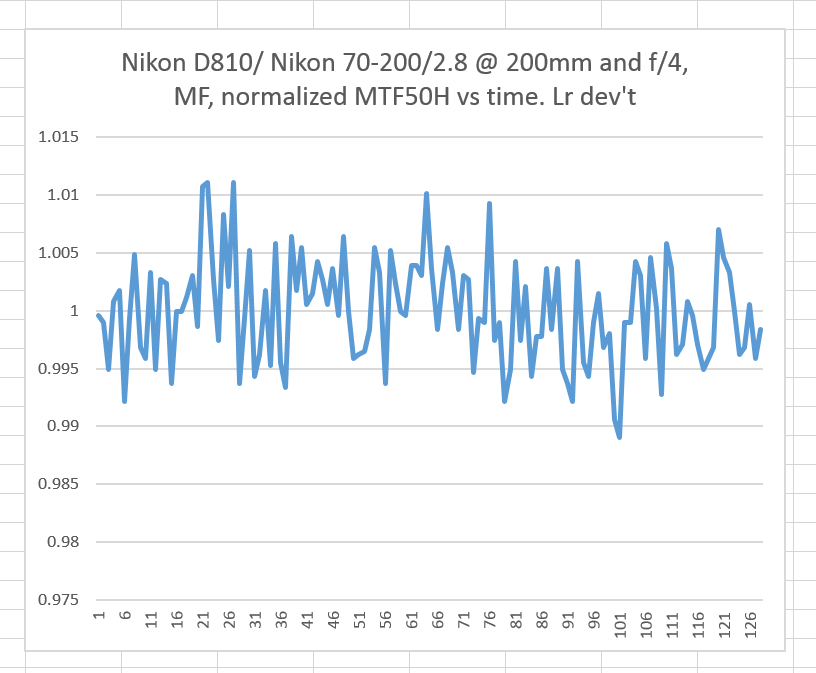
I made 128 exposures at f/4 with the Nikon 70-200/2.8 on a D810, focusing manually (once, wide open), and plotted the central (on-axis) horizontal edge MTF50 in cycles per picture height for the entire series. The time between exposures was 8 seconds for the Nikon gear (4 seconds to focus, then 4 seconds with the mirror up), and 5 seconds with the Sony equipment.
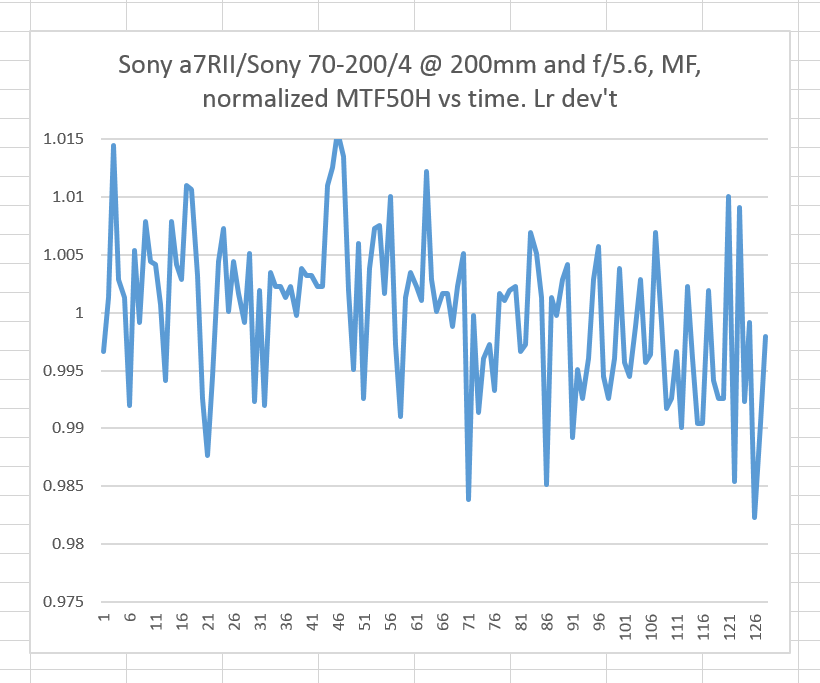
Then I did the same thing with the Sony a7RII and the Sony 70/200/4, this time with the lens at f/5.6, which is sharper for that lens than f/4.
The amount of variation appears to be about the same, although it looks like the Sony gets a bit worse as the series wears on.
Looking at the two sets of data normalized to the average MTF50 for the entire series:
Now, with a more apples/apples comparison, the Sony looks worse. We’ll be looking at standard deviations in a subsequent post.
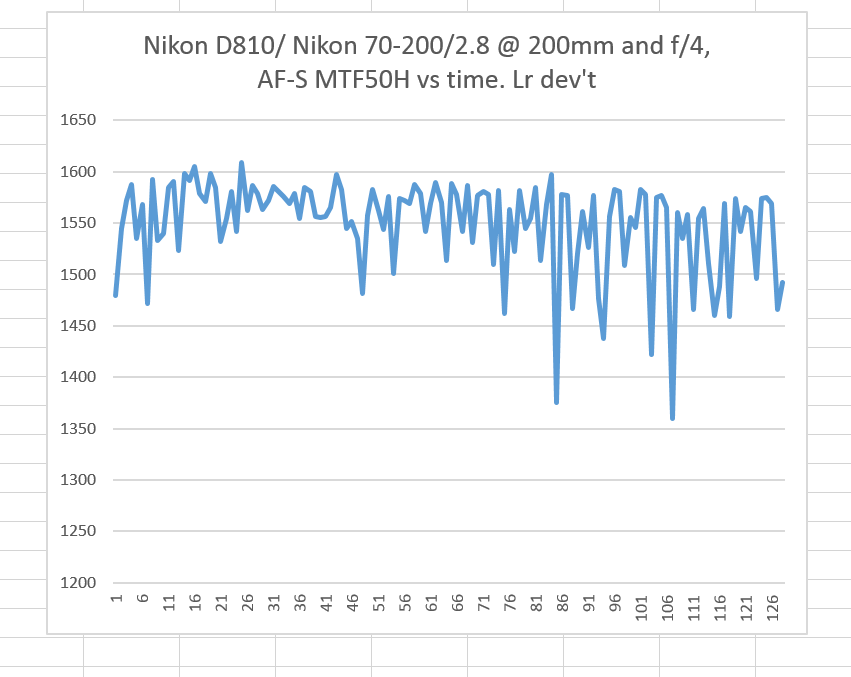
Now let’s look at what happens when we turn autofocus (AF-S, focus priority) on. First, the Nikon plot:
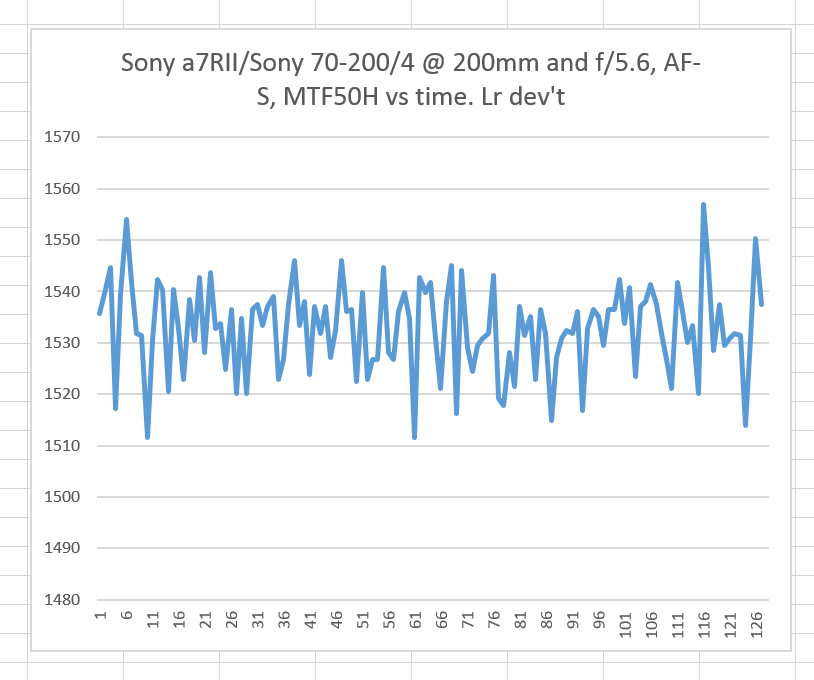
And now the Sony one:
Note the difference in the vertical axes. The Sony is more consistent. We’ve seen this before.
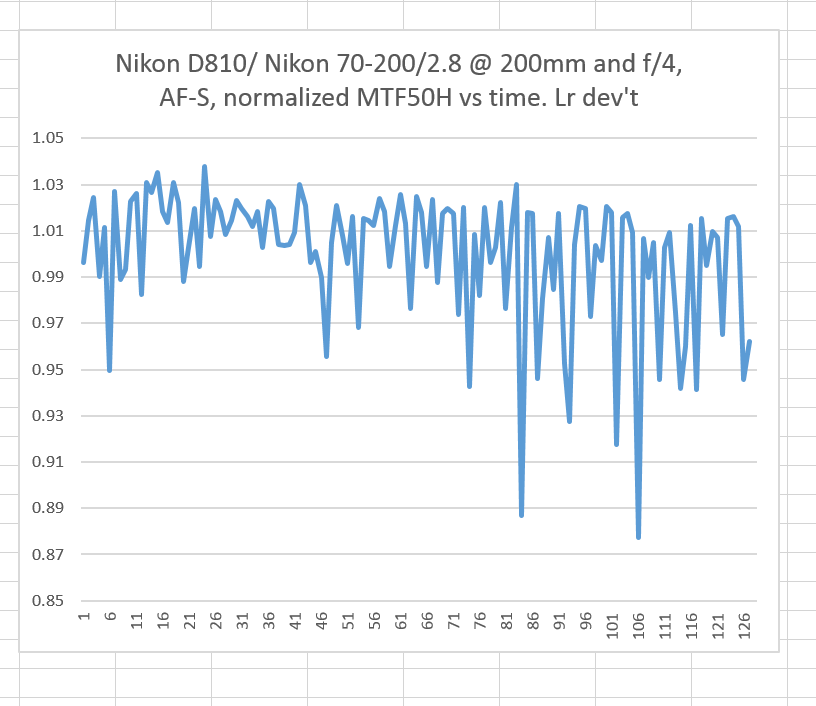
Plotting the normalized results makes things even clearer. The Nikon ones:
And for the Sony:
That certainly makes the point.
Next up: how the above affects our standard statistics.

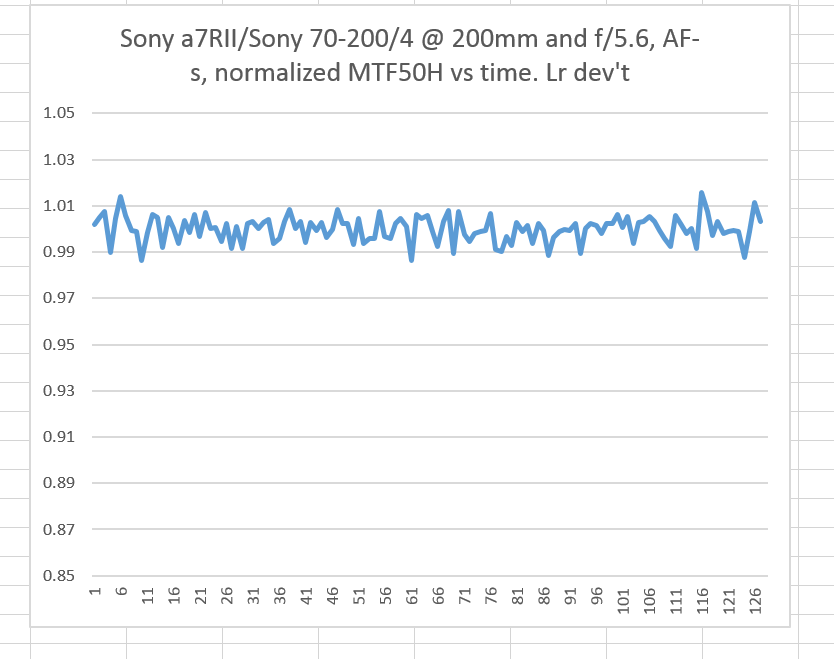
Now we are talking, +/- a couple of percentage points is what I understand is to be expected with good technique. Wow, the Sony’s focusing is really consistent.