A reader commented on the previous post, and posted this link to a web page where he analyzed the spatial aspects of the read noise on a Sony NEX-6. He contends, with excellent justification, that the construction of the sensor on that camera, and sensors with similar column-parallel ADCs, creates more low-frequency read noise in the row direction than the column direction (when the camera is in landscape orientation).
I thought I would adapt his convolution-based analysis techniques to my Nikon D810 ISO 12800 dark-field image, and see if that proved more illuminating than the frequency domain approach of he last post.
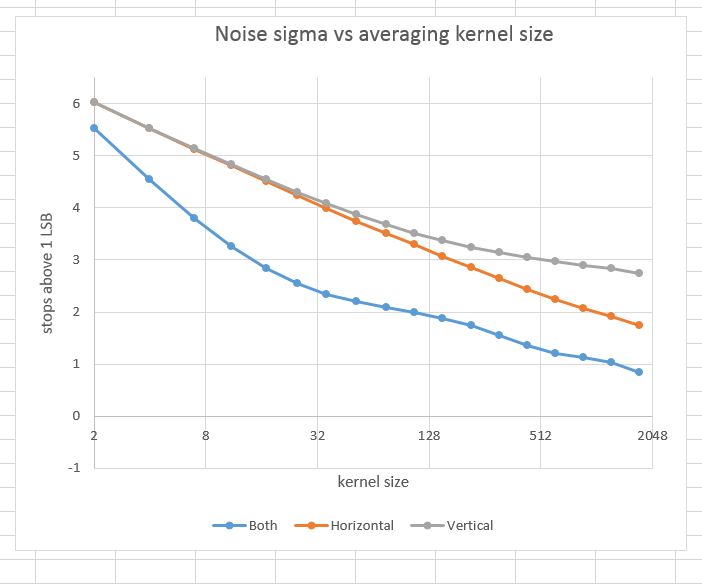
I constructed three families of convolution kernels: nxn (square), 1xn (row-filtering) and nx1 (column-filtering). I passed them in various sizes over the green channel of the raw D810 test, then measured the standard deviation of the resultant images:
You can see that there’s different behavior in the images filtered by the two one-dimensional kernels: that’s called anisotropy. The results are similar to what Ilya discovered with the NEX-6, but with two exceptions. First, the line labeled “Horizontal” has a slight upward curve to it at high kernel sizes, indicating that the noise isn’t white in that direction. Second, the Vertical and Horizontal lines diverge more slowly than in the NEX-6 results (which, to be fair, used a somewhat different methodology), indicating lower DAC noise with the S810 than the NEX-7.
By the way, note that the horizontal kernel preserves vertical features, and vice-versa.
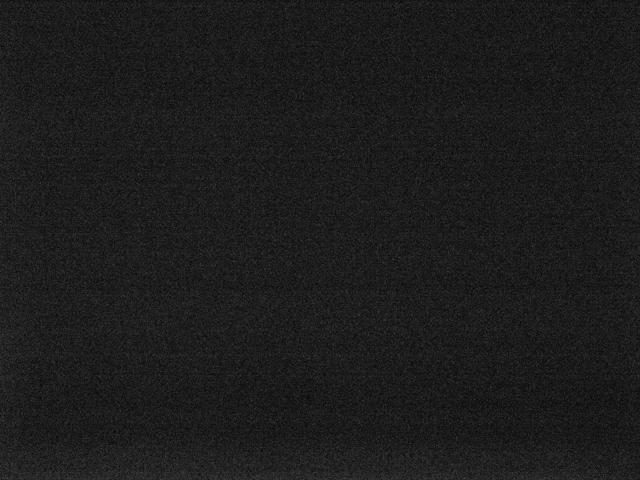
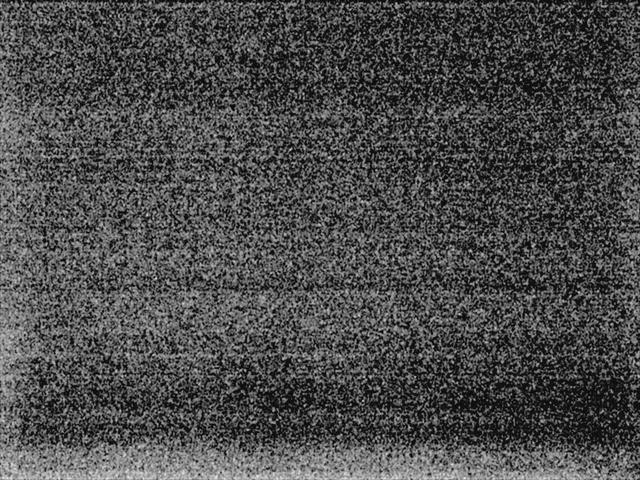
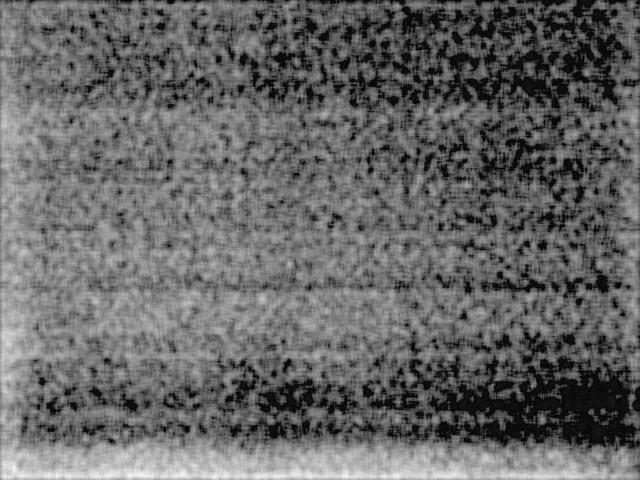
Since I was doing all this filtering anyway, I thought I’d have the program write out the square-kernel-filtered images. What I saw surprised me. Here are some samples, all normalized so each maximum is full scale, and all encoded with a gamma of 2.2.
At a kernel size of 2, random hot pixels prohibit being able to see anything:
With a kernel of 11×11, the columns show much more variation than the rows, making DAC noise look like it’s the culprit:
With a kernel size of 36, a mottling is added to the mix, and it’s not all in one direction:
With a kernel size of 152, there is the crosshatching we saw in the previous post, and some areas of high noise are apparent across the bottom and on the left and, to a lesser extent,, the right side:
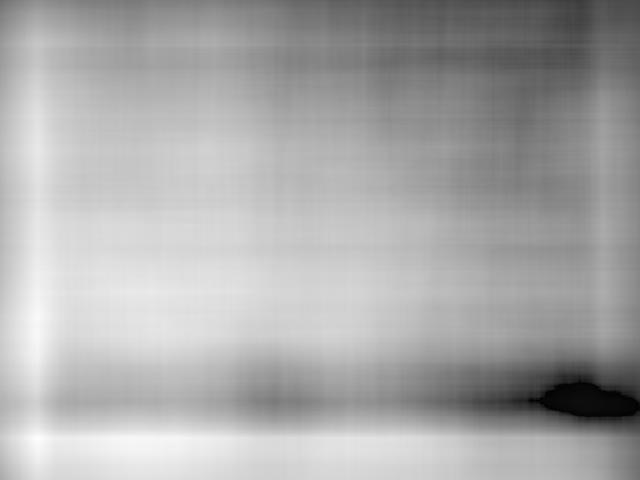
With a 434×434 kernel, the low-frequency systemic noise features are quite visible:
More of same at 1233×1233. By the way, the motion of the features is due to using mirroring near the edges of the images when the kernel needs more data than the image can provide.
What’s this all mean to my quest for finding a metric for the visual effects of read noise? It means it’s a harder problem than I thought. It also means that there may be opportunity to filter out some of the low-frequency read noise components by subtracting a low=pass filtered image, or, equivalently, varying the black point across the sensor field.


Leave a Reply