the last word

Photography meets digital computer technology. Photography wins -- most of the time.

  • site home
  • blog home
  • galleries
  • contact
  • underwater
  • the bleeding edge
You are here: Home / The Last Word / Modeling the Sony alpha 7R

Modeling the Sony alpha 7R

January 1, 2015 JimK Leave a Comment

I’ve received requests to compare the Sony a7R sensor to that in the Nikon D810. I’ll do that next time, but first I have to show you all an analysis of the a7R sensor itself.

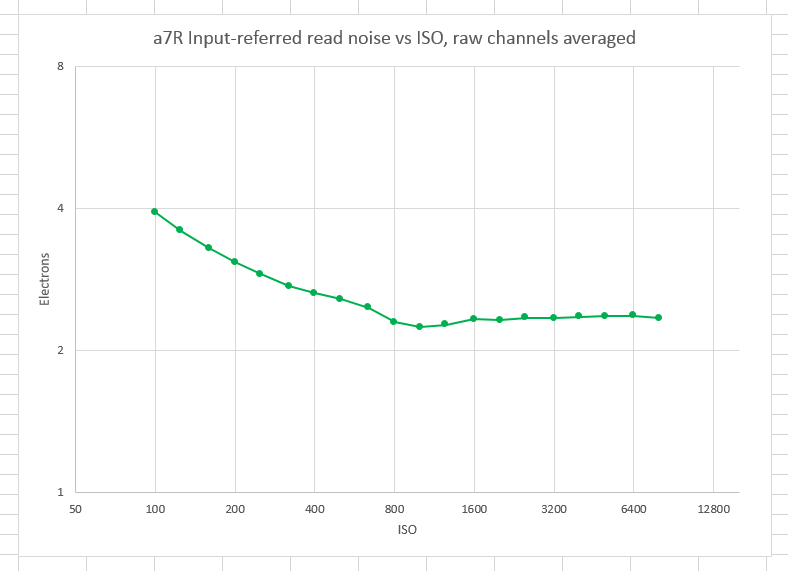
Here is the read noise versus ISO setting, with a separate camera model constructed for the data from each ISO. Only whole-stop ISOs are shown to improve the clarity of the chart, but the data set contains data for 1/3 stop ISO intervals. The read noise is corrected for the amplifier gain, and measured in electrons.

a7R input ref RN


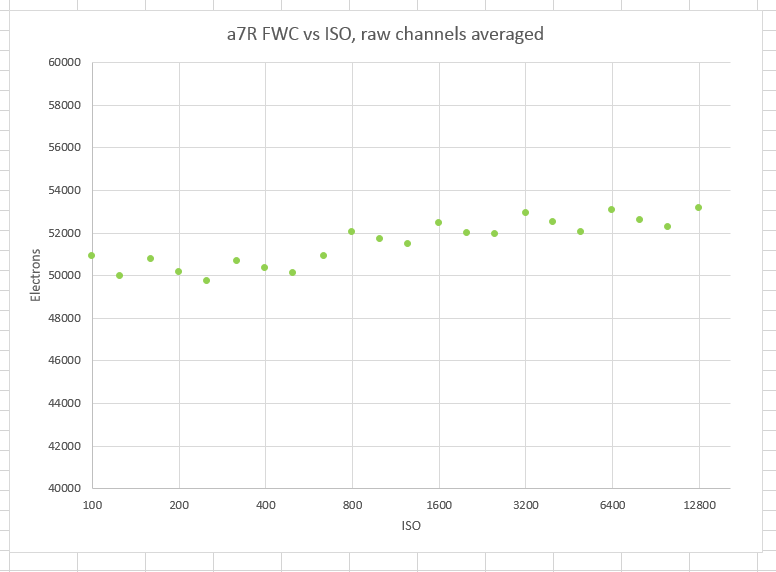
The full well capacity modeled at each ISO shows little systematic pattern, which is what one would expect:

a7rFWCvsISO

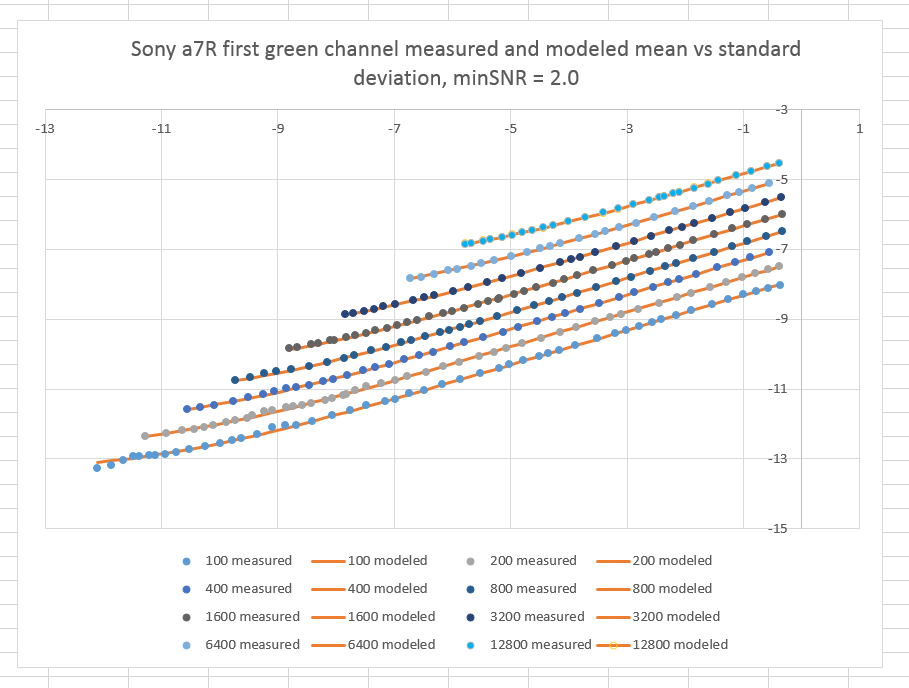
The modeled data fits the measured data well:

a7RmodeledvsMeasured

If you think in terms of SNR instead of standard deviation, here’s the same data graphed that way:

a7RmodVsMeasSNR

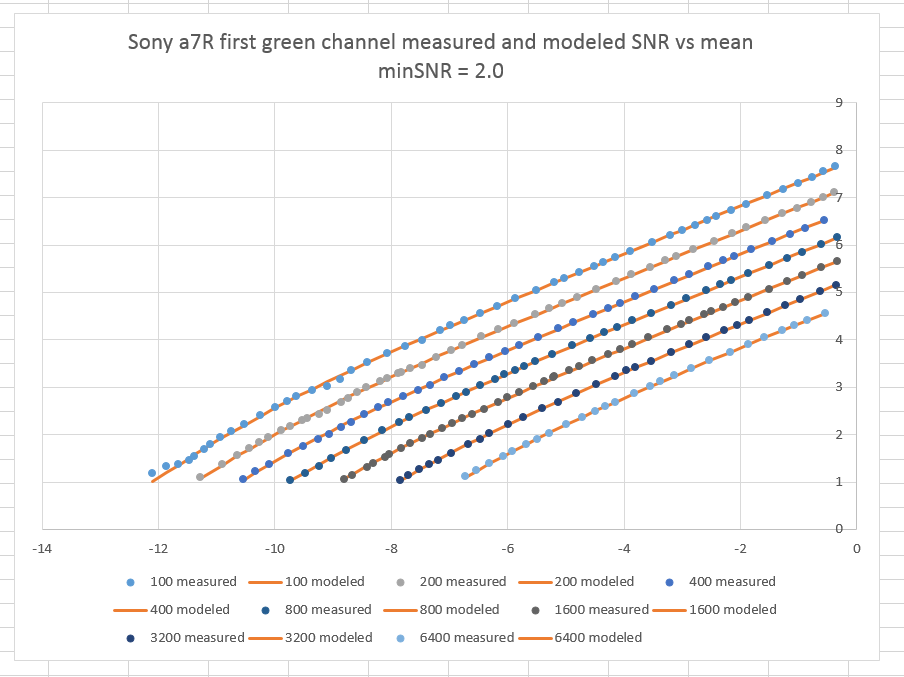
In both graphs, the horizontal axis is the mean value of the region of interest, which was a 200×800 rectangular sample in each raw plane. The mean value is expressed as stops below full scale. The vertical axis of the SNR graph is stops above one. There is no data below an SNR of 2 (which is one stop over SNR = 1) because I had the program remove such data to avoid confusing the modeling routines.

When I have the program model the camera at all ISOs, I get the following values:

a7R all iso results

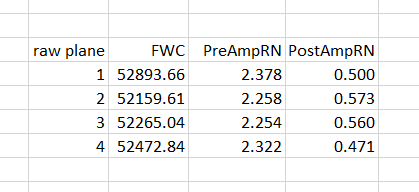
The full well capacity is measured in electrons, as is the pre-amplifier read noise. The post-amplifier read noise is measured in the least-significant bit (LSB) of the the analog to digital converter ADC). The a7R uses various conversion bit depths depending on shutter modes. DCRAW calls it 12-bit, and the post-amplifier RN is presented assuming that bit depth. .If you think of the camera as a 14-bit device, multiply those numbers by four.

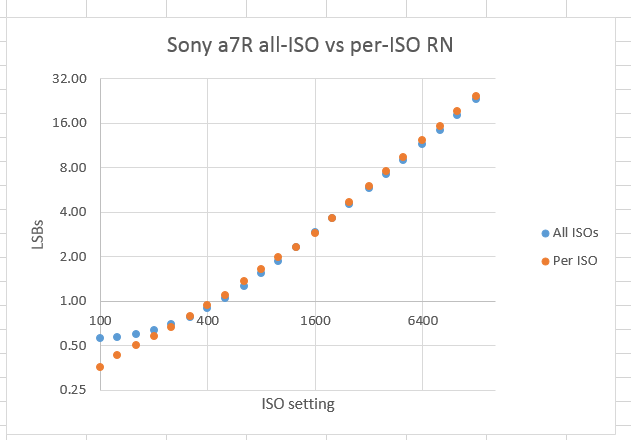
When I compared the read noise modeled per-ISO with the model for all ISOs, I found the per-ISO read noise at low ISO settings to be better than the all-ISO model would predict, and worse at high ISO settings than the all-ISO model would predict,:

a7RallIsovsPerISO

Here’s what the difference between the RN modeled both ways looks like:

a7RAllISOvsPerISODeltaPct

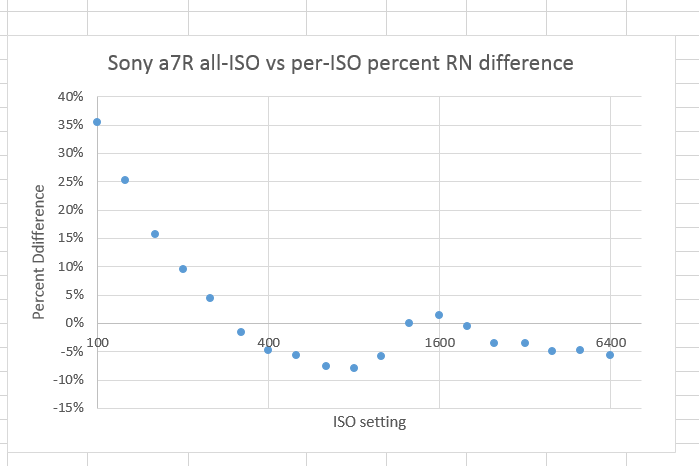
There’s something funny happening at around ISO 1600, but it’s not a very strong effect.

The Last Word

← Shutter shock revisited D810 vs a7R sensor performance →

Leave a Reply Cancel reply

Your email address will not be published. Required fields are marked *

May 2022
S M T W T F S
1234567
891011121314
15161718192021
22232425262728
293031  
« Apr    

Articles

  • About
    • Patents and papers about color
    • Who am I?
  • Good 35-70 MF lens
  • How to…
    • Backing up photographic images
    • How to change email providers
  • Lens screening testing
    • Equipment and Software
    • Examples
      • Bad and OK 200-600 at 600
      • Excellent 180-400 zoom
      • Fair 14-30mm zoom
      • Good 100-200 mm MF zoom
      • Good 100-400 zoom
      • Good 100mm lens on P1 P45+
      • Good 120mm MF lens
      • Good 18mm FF lens
      • Good 24-105 mm FF lens
      • Good 24-70 FF zoom
      • Good 35 mm FF lens
      • Good 60 mm lens on IQ3-100
      • Good 63 mm MF lens
      • Good 65 mm FF lens
      • Good 85 mm FF lens
      • Good and bad 25mm FF lenses
      • Good zoom at 24 mm
      • Marginal 18mm lens
      • Marginal 35mm FF lens
      • Mildly problematic 55 mm FF lens
      • OK 16-35mm zoom
      • OK 60mm lens on P1 P45+
      • OK Sony 600mm f/4
      • Pretty good 16-35 FF zoom
      • Pretty good 90mm FF lens
      • Problematic 400 mm FF lens
      • Tilted 20 mm f/1.8 FF lens
      • Tilted 30 mm MF lens
      • Tilted 50 mm FF lens
      • Two 15mm FF lenses
    • Found a problem – now what?
    • Goals for this test
    • Minimum target distances
      • MFT
      • APS-C
      • Full frame
      • Small medium format
    • Printable Siemens Star targets
    • Target size on sensor
      • MFT
      • APS-C
      • Full frame
      • Small medium format
    • Test instructions — postproduction
    • Test instructions — reading the images
    • Test instructions – capture
    • Theory of the test
    • What’s wrong with conventional lens screening?
  • Previsualization heresy
  • Privacy Policy
  • Recommended photographic web sites
  • Using in-camera histograms for ETTR
    • Acknowledgments
    • Why ETTR?
    • Normal in-camera histograms
    • Image processing for in-camera histograms
    • Making the in-camera histogram closely represent the raw histogram
    • Shortcuts to UniWB
    • Preparing for monitor-based UniWB
    • A one-step UniWB procedure
    • The math behind the one-step method
    • Iteration using Newton’s Method

Category List

Recent Comments

  • Luís Filipe da Cunha on How to practice
  • James Sullivan on Leica Q2 Monochrom vs GFX 50S — Siemens star
  • James Sullivan on Leica Q2 Monochrom vs GFX 50S — Siemens star
  • JimK on Uncurling the Leica Q2 Monochrom strap
  • James on Uncurling the Leica Q2 Monochrom strap
  • JimK on D850 exposure strategy — manual settings
  • Alex Ramsay on D850 exposure strategy — manual settings
  • Michael Klein on Moving away from Sony cameras
  • JimK on Leica Q2 has a real raw histogram
  • JimK on Leica Q2 has a real raw histogram

Archives

Copyright © 2022 · Daily Dish Pro On Genesis Framework · WordPress · Log in

Unless otherwise noted, all images copyright Jim Kasson.