This is one in a series of posts on the Nikon Z6 and Z7. You should be able to find all the posts about that camera in the Category List on the right sidebar, below the Articles widget. There’s a drop-down menu there that you can use to get to all the posts in this series; just look for “Nikon Z6/7”.
There has recently been some controversy about the relative noise behavior of the Nikon Z6 and Z7 in deep shadows. I intend to address those differences in a series of posts which will include both quantitative results and visual ones. If you go to the bottom of this post you’ll see pingback links to all of the other posts about Z6 and Z7 shadow noise.
When I started down this road last week, I ran into some conflicts among some of the basic camera measurements performed by respected practitioners. Since these influence the numerical results that I’m calculating, I need to resolve these. So I went back and preformed my own measurements on the two cameras, something that I had not done before.
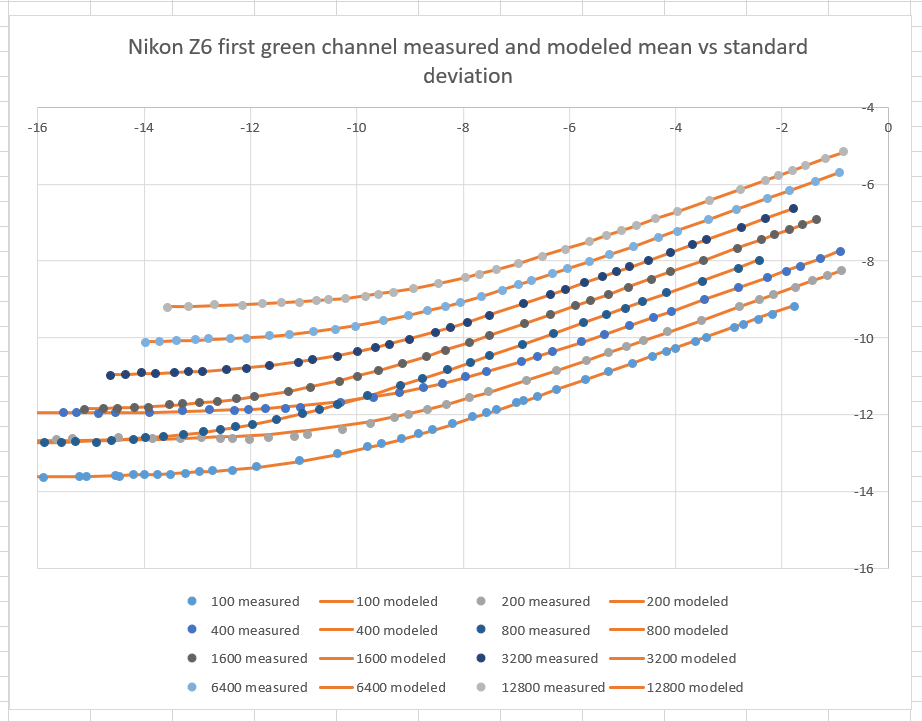
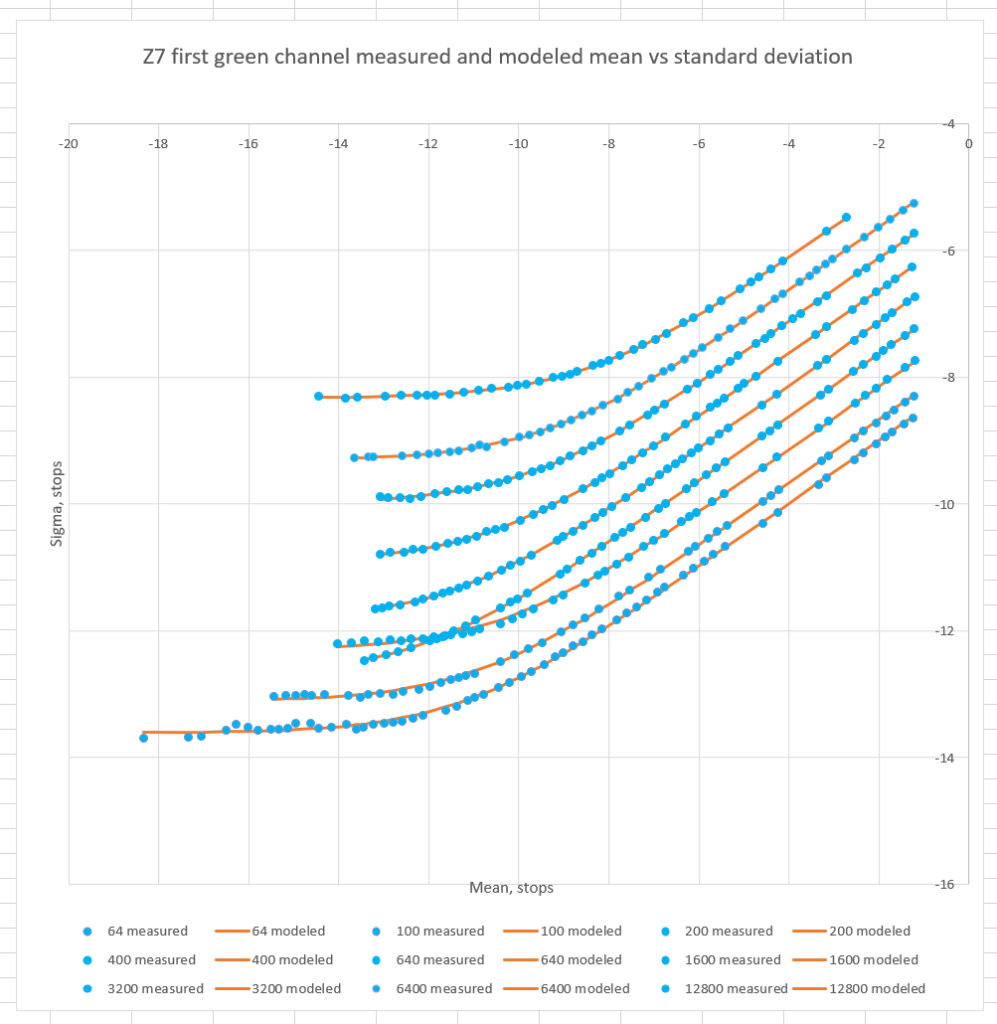
The first thing I did was measure the photon transfer curves for the cameras at various ISO settings. Here’s what I got at the whole ISO steps:
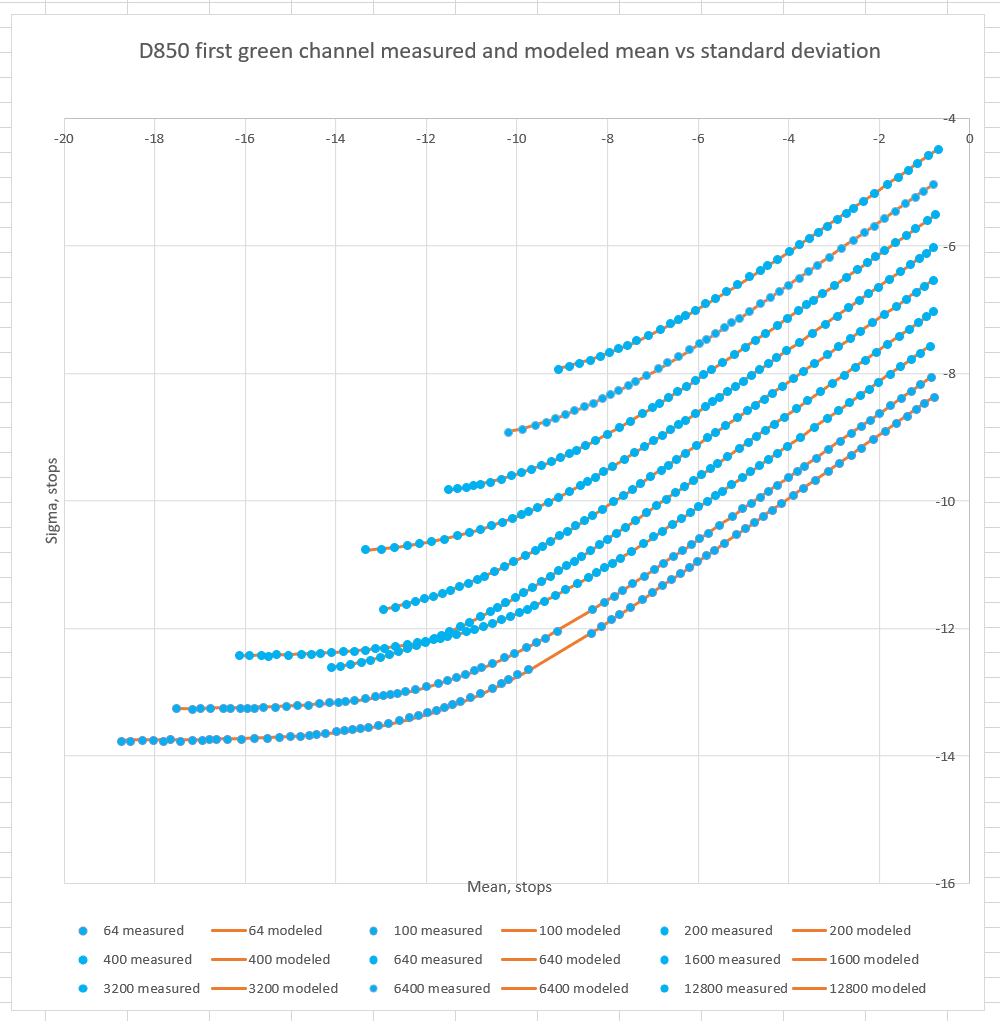
For comparison, here are the D850 curves:
I’ll explain these curves. The horizontal axis is the average signal level, in stops below full scale. The vertical axis is the root-mean-square (rms) noise, which is the same as the standard deviation (sigma) of the captured data. The lower curves are the ones at lower ISO settings; as the ISO setting increases, so does the rms noise relative to full scale.
The program that crunched the data was one that Jack Hogan and I wrote several years ago, and that has been much modified by me since. It not only plots the measured data — the blue points — but it models the sensor and displays the results of the model as the orange lines. The agreement is good in all cases above.
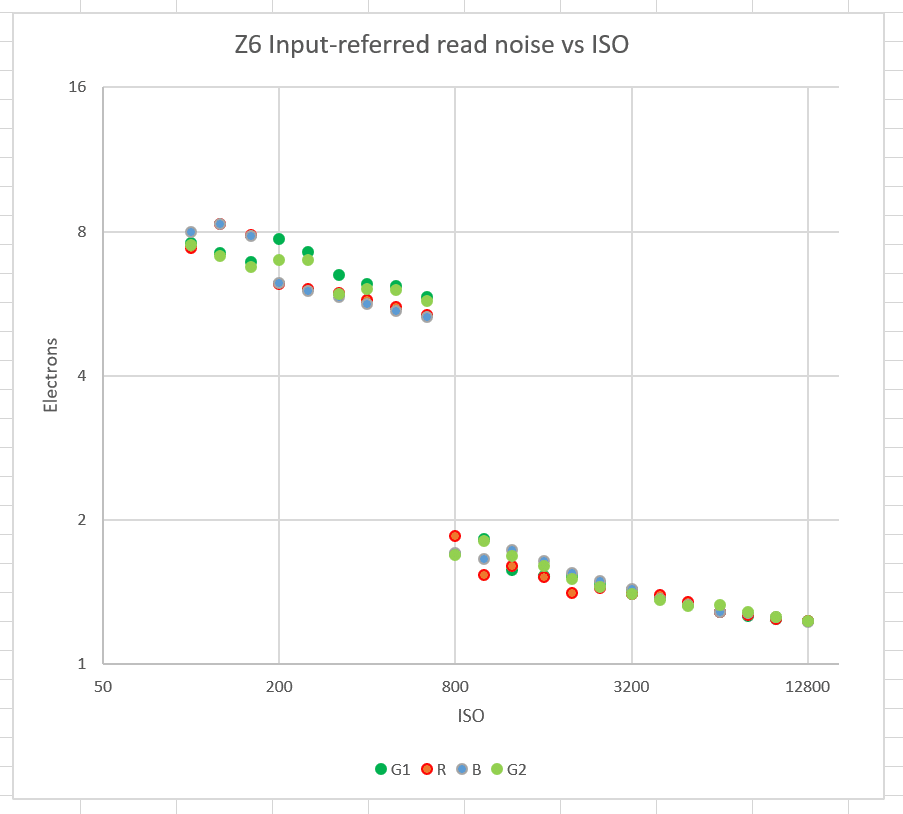
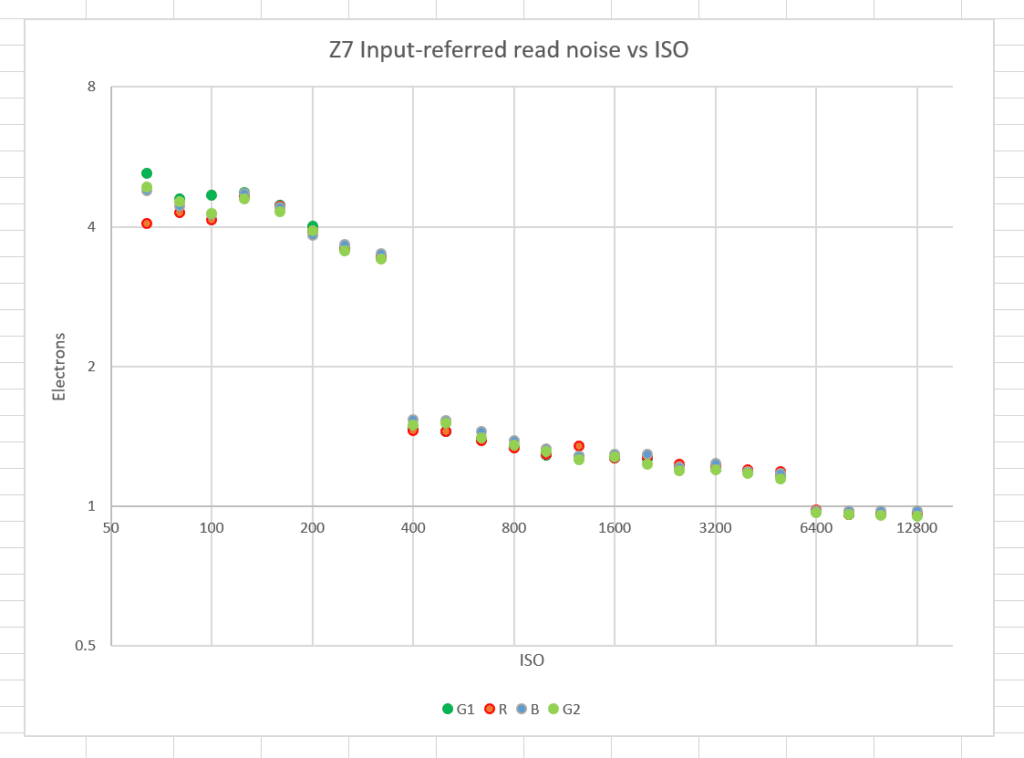
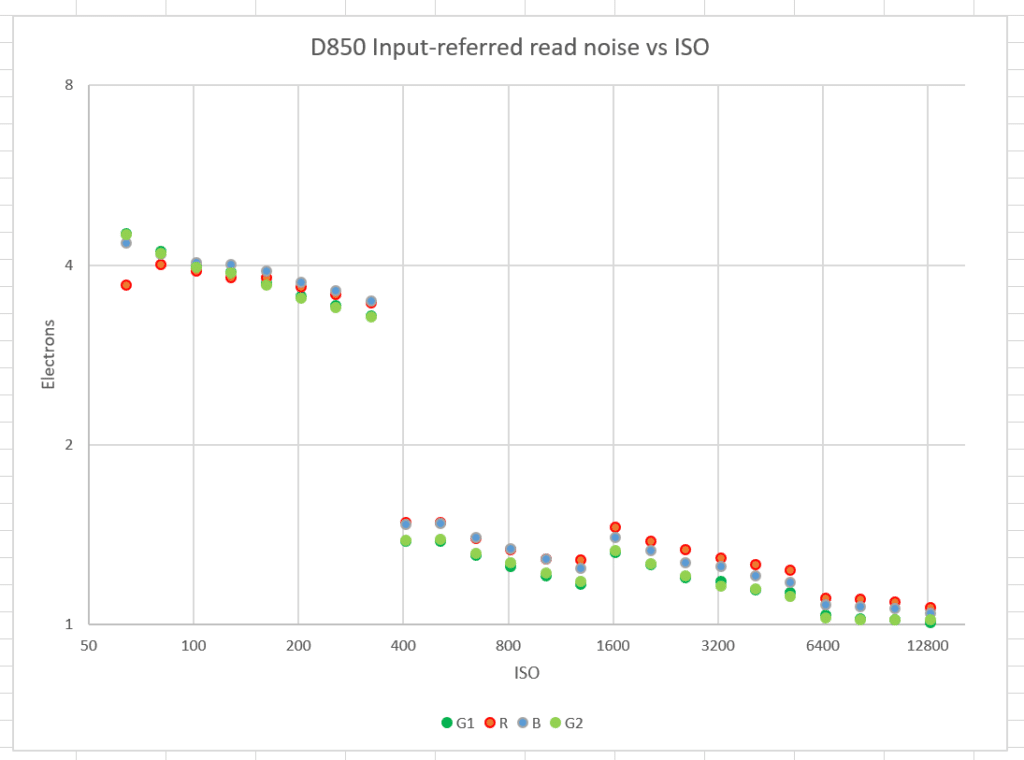
The modeling part of the program computes input referred input-referred read noise (RN) and full well capacity (FWC). The input-referred part means that it calculates the noise in terms of the number of electrons captured. Here’s what it got:
Both the Z6 and Z7 curves are distinguished by large drops in the input-referred read noise at particular ISO steps. That is the result of the conversion gain (the ratio between the voltage on the pixel and the number of electrons stored there) changing. The technology employed was invented by Aptina, and is used in many modern Sony sensors.
The D850 looks a lot like the D7:
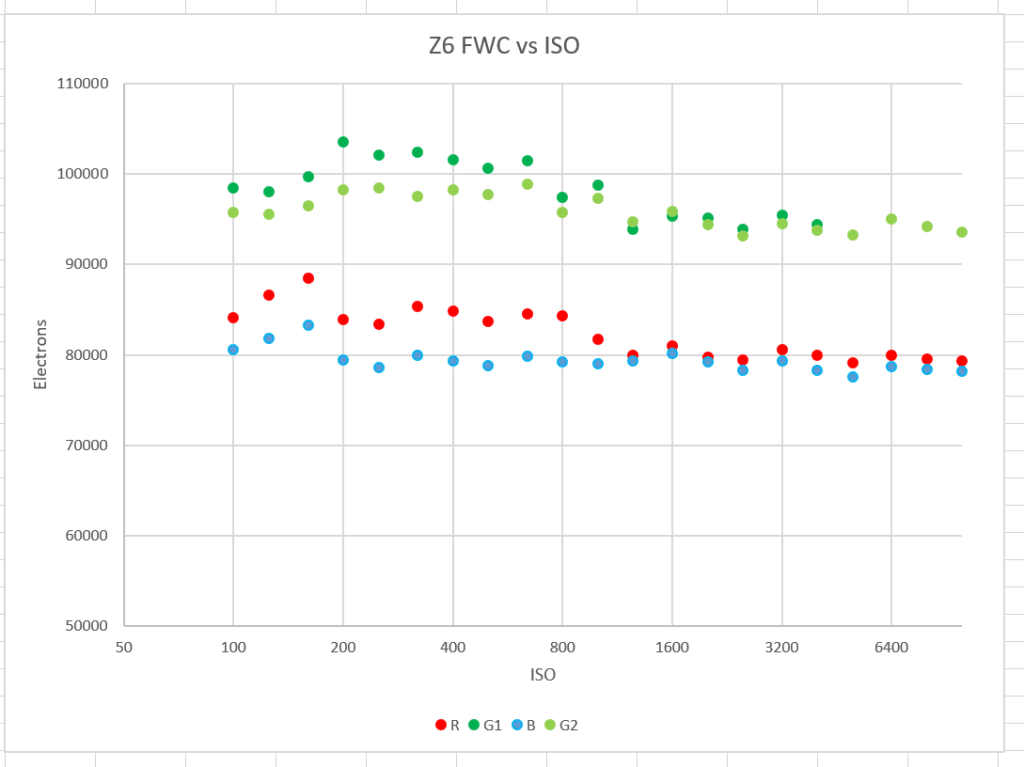
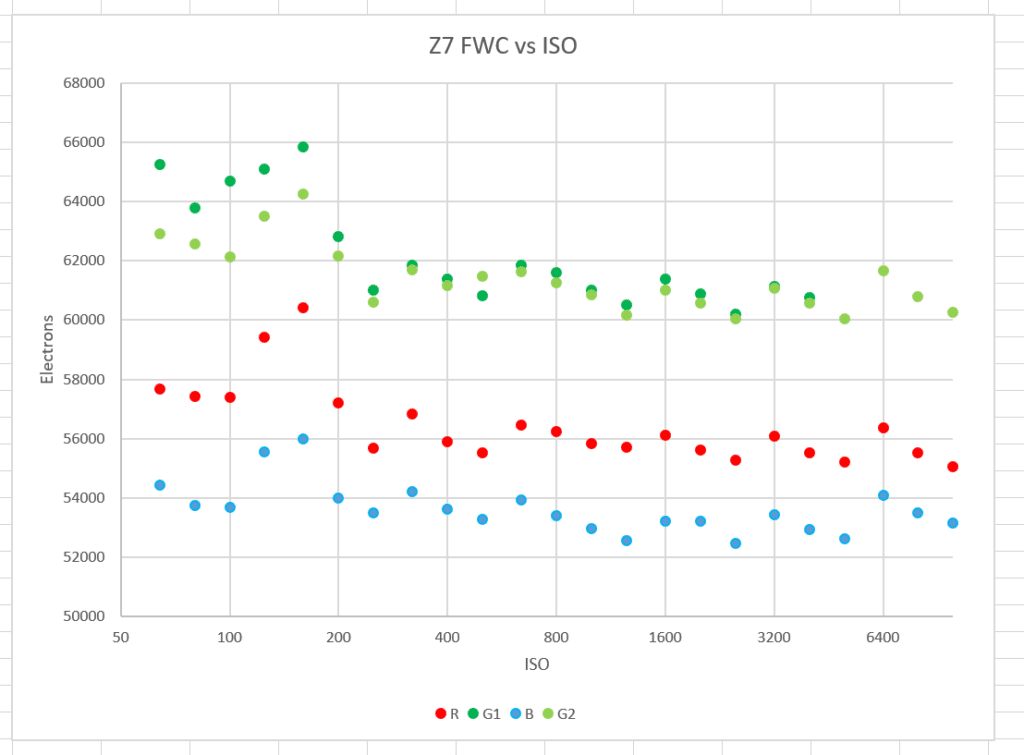
The FWC’s for each raw channel and for each ISO, follow:
The green channels have higher FWCs because Nikon pre-scales the red and blue channels in a — misguided, IMHO — calibration scheme.
For the Z6, the average green-channel FWC is 96600 electrons, and that of the Z7 is 61700. DxO puts the Z6 at 83700 and the Z7 at 58500. Bill Claff performs the calculation two different ways. The one in which he has the most confidence gets 93100 for the Z6 and 66100 for the Z7. I’m going to go with my numbers in the posts to follow.
My FWCs imply 3200 electrons per square micrometer (e-/um2) for the Z7 and 2700 for the Z6. Modern cameras tend to average around 3000 e-/um2.
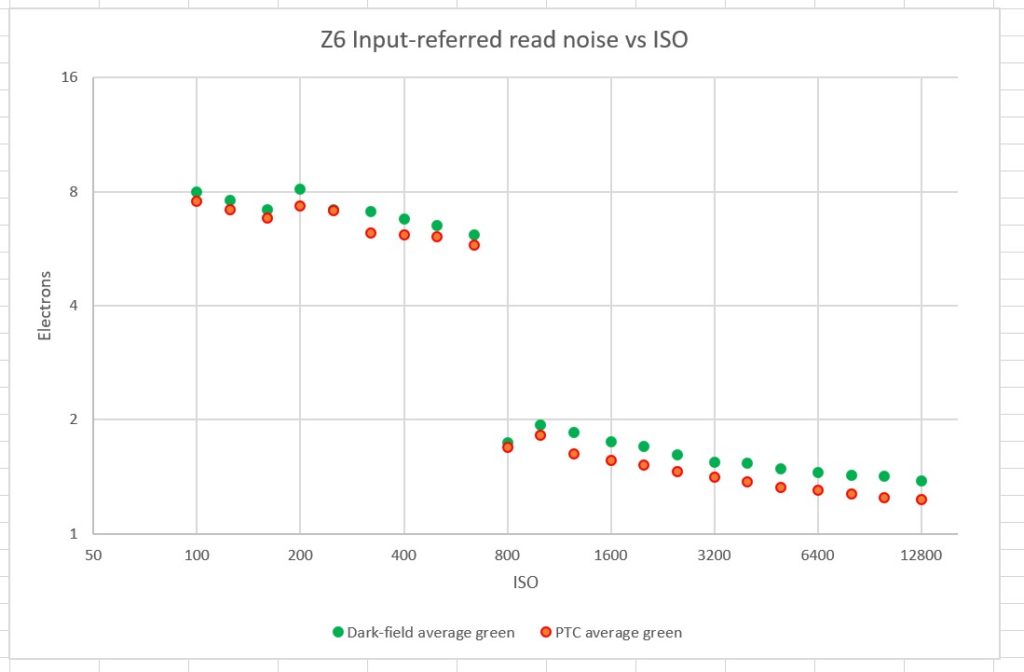
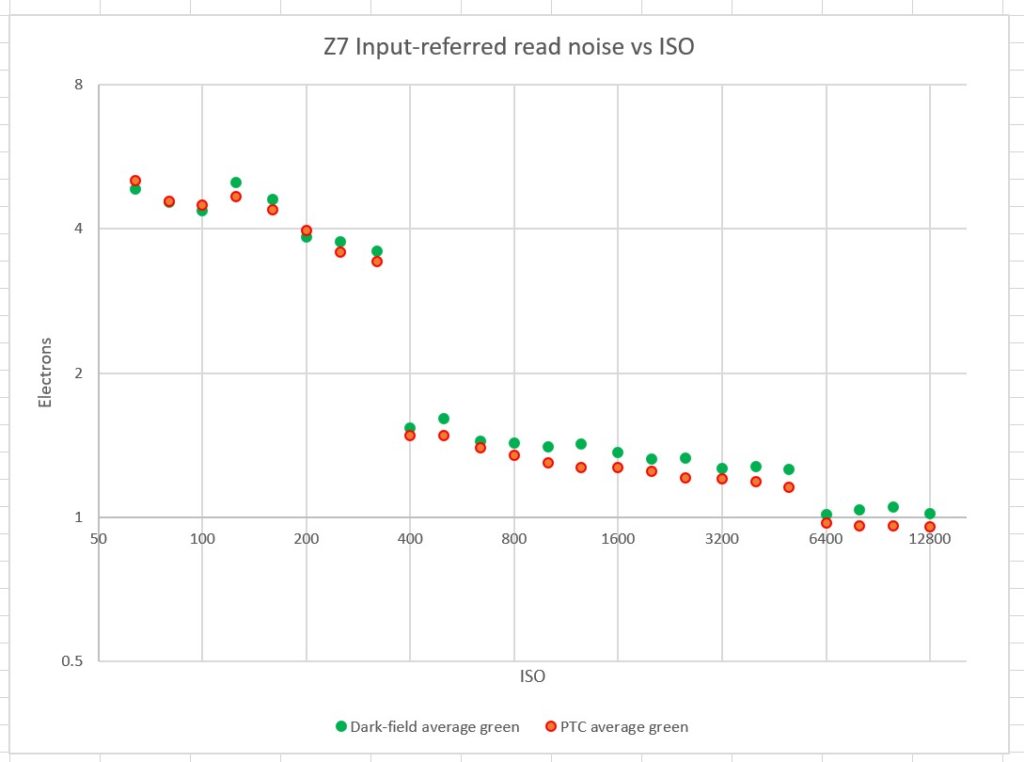
As a check on the read noise curves above, which were created by fitting a model of the camera to the photon transfer curve data, I looked at the same curves obtained by direct measurement of dark-field images at 1/1000 second. These are for the average of the two green channels.
The agreement is good.
A lot of dry numbers in this post. Be patient, I’ll be using the data to make calculations that are relevant to photography in the next few.
Jack Hogan says
Interesting, rather busy FWCs in the first couple of stops from base for the two Zs.
What do we make of the apparently raised read noise in the 1600 to 5100 ISO range for both the Z7 and D850 Jim?
Anu Nyymi says
I think you should change the FWC charts as clearly the photo electron capacities of the pixels are reduced as the ISO is increased. Now the charts are just wrong and confusing – one gets the idea that for example dynamic range increases with ISO… 😀
JimK says
An interesting point. If you think FWC means the clipping level in the raw file, then what you say is correct. If you think of FWC as referring to the sensor pixel before amplification — both digital and analog — then FWC doesn’t change with ISO setting. A sensor design engineer would have a definition of FWC that is different yet.